This allows staff with access to view both generic Dashboards and, to view the data relevant to their own business. Download a PDF of these instructions here.
Instructions
Login to the IFSO Scheme Portal using your Username and Password. If you don’t have your password, please contact brendan@ifso.nz
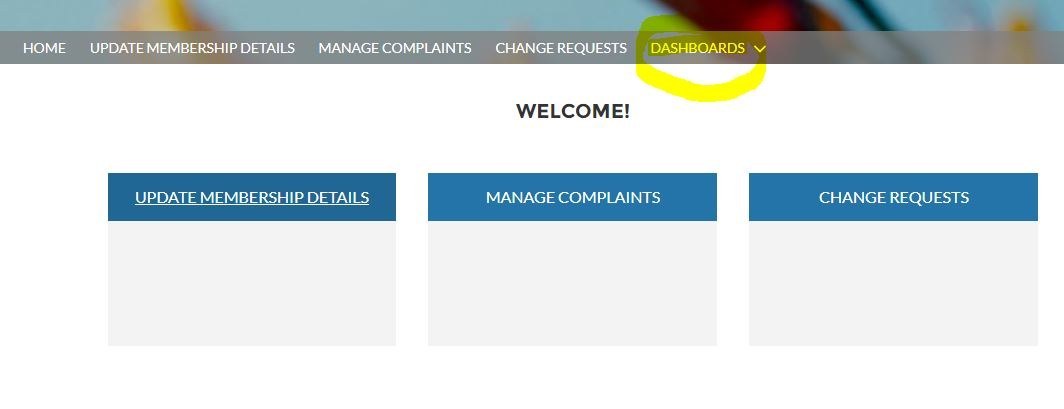
The Dashboards tab is located on the right of the screen menu.
From this dropdown Dashboard menu, select the dashboard(s) relevant to your business. There are 5 Dashboards to choose from;
Please Note – you can view Dashboards unrelated to your business but you cannot see any underlying data.
After selecting the Dashboard you wish to view, you will be presented with graphs (“Components”) displaying the statistics for the last Financial Quarter (“Last FQ”) across that industry.
For example in the F&G Industry Dashboard below;
You can access your own company data by selecting “View Report” at the bottom of each dashboard component, for example – “Complaints Accepted”;
This then displays the number of Complaints Accepted for your business over the same period, for example;
The time period (“range”) defaults to the Last FQ, but you can choose your own range if you wish, for example “Current Financial Year”.
You do this by selecting the filter button at the top right of the screen and amending the range from the dropdown menu. Note: "Financial Year" is defined as 1 July to 30 June, which may not align with your financial year.
Use “Custom” to choose a date range not listed.
Note – DO NOT alter the “Date” field.
You can then view the cases corresponding to the time period selected by selecting “Detail Rows” at the base of the report:
If you try to access data you do not have authority to see, you will see an error message like this: